Description
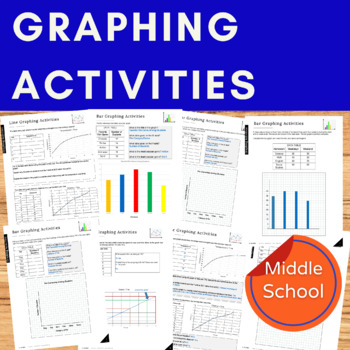
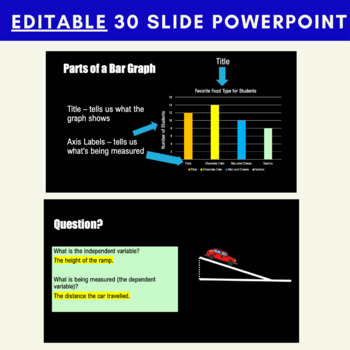
Your students will love learning about graphing with these activities. This comprehensive packet includes a 30 slide powerpoint which covers how to make bar graphs and line graphs as well as worksheets that are specially designed to allow plenty of practise. The entire resource is editable so you can customize it.
❤️ “My students really enjoyed the engagement. Thank you”. Donnamarie E.
❤️ “My students have a hard time with graphing and interpreting graphs. I use these as enrichment/skill building activities.” Brianne Secorsky.
The powerpoint covers
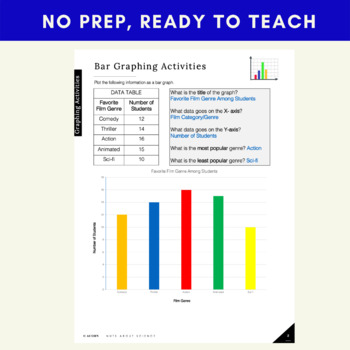
Bar Graphs
- What are they used for
- The parts of a bar graph: scale, units, legend, title, accuracy, neatness (SULTAN)
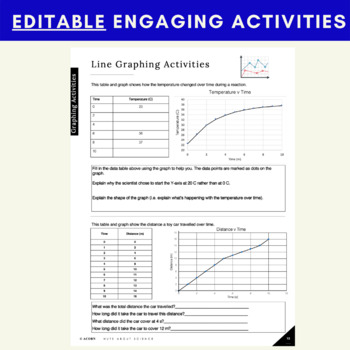
Line Graphs
- What are they used for
- The parts of a line graph: scale, units, legend, title, accuracy, neatness (SULTAN)
- Independent/Dependent variables and where they go on a graph
- Reading Data from a graph
- Making Predictions from a graph
- Not starting a scale at zero and why it’s useful
Worksheet Activities (16 pages including answer keys)
The worksheets can be used as an in class activity, as stations or as homework. Answer keys are provided so they can self correct and save you time.
The worksheets are designed to allow the student quick wins while getting progressively more challenging.

